kubectl-trace
![]()
kubectl trace is a kubectl plugin that allows you to schedule the execution of bpftrace programs in your Kubernetes cluster.
Installing§
Krew§
You can install kubectl trace using the Krew, the package manager for kubectl plugins.
Once you have Krew installed just run:
kubectl krew install traceYou're ready to go!
Pre-built binaries§
See the release page for the full list of pre-built assets.
The commands here show amd64 versions, 386 versions are available in the releases page.
Linux
curl -L -o kubectl-trace.tar.gz https://github.com/iovisor/kubectl-trace/releases/download/v0.1.0-rc.1/kubectl-trace_0.1.0-rc.1_linux_amd64.tar.gz
tar -xvf kubectl-trace.tar.gz
mv kubectl-trace /usr/local/bin/kubectl-trace
OSX
curl -L -o kubectl-trace.tar.gz https://github.com/iovisor/kubectl-trace/releases/download/v0.1.0-rc.1/kubectl-trace_0.1.0-rc.1_darwin_amd64.tar.gz
tar -xvf kubectl-trace.tar.gz
mv kubectl-trace /usr/local/bin/kubectl-trace
Windows
In PowerShell v5+
$url = "https://github.com/iovisor/kubectl-trace/releases/download/v0.1.0-rc.1/kubectl-trace_0.1.0-rc.1_windows_amd64.zip"
$output = "$PSScriptRoot\kubectl-trace.zip"

Invoke-WebRequest -Uri $url -OutFile $output
Expand-Archive "$PSScriptRoot\kubectl-trace.zip" -DestinationPath "$PSScriptRoot\kubectl-trace"Source§
Using go modules, you can build kubectl-trace at any git tag:
GO111MODULE=on go get github.com/iovisor/kubectl-trace/cmd/kubectl-trace@latestThis will download and compile kubectl-trace so that you can use it as a kubectl plugin with kubectl trace, note that you will need to be on a recent version of go which supports go modules.
To keep track of the ref you used to build, you can add an ldflag at build time to set this to match the ref provided to go modules:
> GO111MODULE=on go get -ldflags='-X github.com/iovisor/kubectl-trace/pkg/version.gitCommit=v0.1.2' github.com/iovisor/kubectl-trace/cmd/[email protected]
> $GOHOME/bin/kubectl-trace version
git commit: v0.1.2
build date: 2021-08-10 12:38:37.921341766 -0400 EDT m=+0.034327432
Note: It is recommended you build tagged revisions only if you are looking for stability. Building branches such as master or the latest tag may result in a more unstable build which has received less QA than a tagged release.
Packages§
You can't find the package for your distro of choice? You are very welcome and encouraged to create it and then open an issue to inform us for review.
Arch - AUR§
The official PKGBUILD is on AUR.
If you use yay to manage AUR packages you can do:
yay -S kubectl-trace-gitArchitecture§
See architecture.md
Usage§
You don't need to setup anything on your cluster before using it, please don't use it already on a production system, just because this isn't yet 100% ready.
Run a program from string literal§
In this case we are running a program that probes a tracepoint on the node ip-180-12-0-152.ec2.internal.
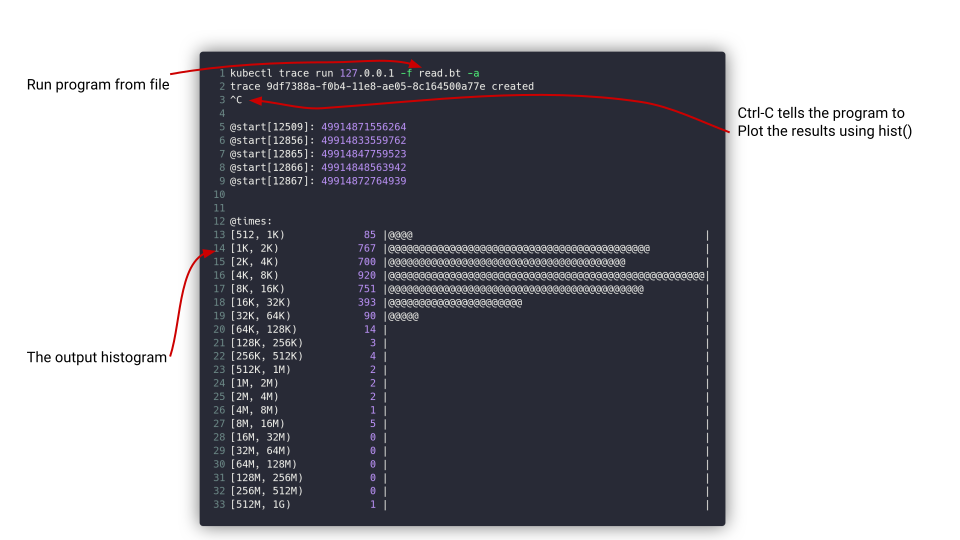
kubectl trace run ip-180-12-0-152.ec2.internal -e "tracepoint:syscalls:sys_enter_* { @[probe] = count(); }"Run a program from file§
Here we run a program named read.bt against the node ip-180-12-0-152.ec2.internal
kubectl trace run ip-180-12-0-152.ec2.internal -f read.btRun a program against a Pod§
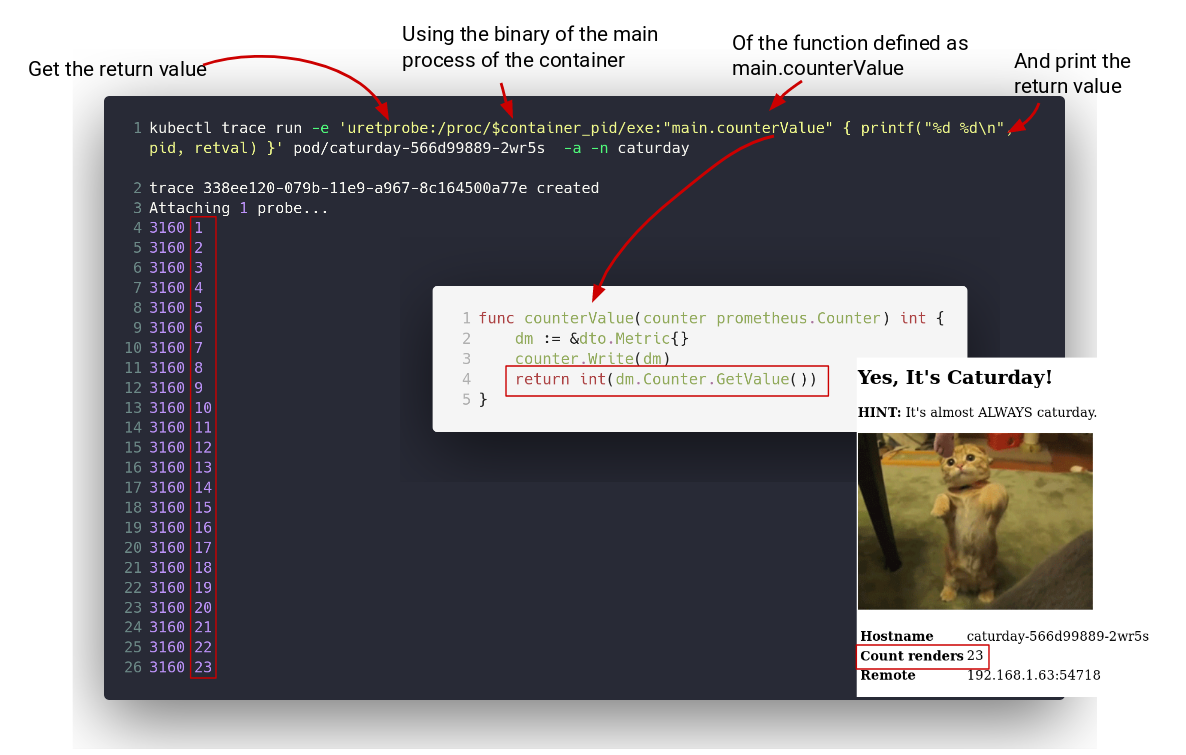
That pod has a Go program in it that is at /caturday, that program has a function called main.counterValue in it that returns an integer every time it is called.
The purpose of this program is to load an uretprobe on the /caturday binary so that every time the main.counterValue function is called we get the return value out.
Since kubectl trace for pods is just an helper to resolve the context of a container's Pod, you will always be in the root namespaces but in this case you will have a variable $container_pid containing the pid of the root process in that container on the root pid namespace.
What you do then is that you get the /caturday binary via /proc/$container_pid/exe, like this:
kubectl trace run -e 'uretprobe:/proc/$container_pid/exe:"main.counterValue" { printf("%d\n", retval) }' pod/caturday-566d99889-8glv9 -a -n caturdayRunning against a Pod vs against a Node§
In general, you run kprobes/kretprobes, tracepoints, software, hardware and profile events against nodes using the node/node-name syntax or just use the node name, node is the default.
When you want to actually probe an userspace program with an uprobe/uretprobe or use an user-level static tracepoint (usdt) your best bet is to run it against a pod using the pod/pod-name syntax.
It's always important to remember that running a program against a pod, as of now, is just a facilitator to find the process id for the binary you want to probe on the root process namespace.
You could do the same thing when running in a Node by knowing the pid of your process yourself after entering in the node via another medium, e.g: ssh.
So, running against a pod doesn't mean that your bpftrace program will be contained in that pod but just that it will pass to your program some knowledge of the context of a container, in this case only the root process id is supported via the $container_pid variable.
Using a custom service account§
By default kubectl trace will use the default service account in the target namespace (that is also default), to schedule the pods needed for your bpftrace program.
If you need to pass a service account you can use the --serviceaccount flag.
kubectl trace run --serviceaccount=kubectltrace ip-180-12-0-152.ec2.internal -f read.btExecuting in a cluster using Pod Security Policies§
If your cluster has pod security policies you will need to make so that kubectl trace can use a service account that can run privileged containers.
That service account, then will need to be in a group that uses the proper privileged PodSecurityPolicy.
First, create the service account that you will use with kubectl trace, you can use a different namespace other than default, just remember to pass that namespace to the run command when you will use kubectl trace:
apiVersion: v1
kind: ServiceAccount
metadata:
  name: kubectltrace
  namespace: default
Now that we have a kubectltrace service account let's create a Pod Security Policy:
apiVersion: policy/v1beta1
kind: PodSecurityPolicy
metadata:
  name: kubectltrace
spec:
  fsGroup:
    rule: RunAsAny
  privileged: true
  runAsUser:
    rule: RunAsAny
  seLinux:
    rule: RunAsAny
  supplementalGroups:
    rule: RunAsAny
  volumes:
  - '*'
  allowedCapabilities:
  - '*'
  hostPID: true
  hostIPC: true
  hostNetwork: true
  hostPorts:
  - min: 1
    max: 65536
Ok, this PodSecurityPolicy will allow users assigned to it to run privileged containers, kubectl trace needs that because of the extended privileges eBPF programs need to run with to trace your kernel and programs running in it.
Now with a ClusterRoleBinding you bind the ClusterRole with the ServiceAccount, so that they can work together with the PodSecurityPolicy we just created.
You can change the namespace: default here if you created the service account in a namespace other than default.
apiVersion: rbac.authorization.k8s.io/v1
kind: ClusterRole
metadata:
  name: kubectltrace-psp
rules:
- apiGroups:
  - policy
  resources:
  - podsecuritypolicies
  resourceNames:
  - kubectltrace
  verbs:
  - use
apiVersion: rbac.authorization.k8s.io/v1
kind: ClusterRoleBinding
metadata:
    name: kubectltrace-psp
subjects:
- kind: ServiceAccount
  name: kubectltrace
  namespace: default
roleRef:
   apiGroup: rbac.authorization.k8s.io
   kind: ClusterRole
   name: kubectltrace-psp
OK! Now that we are all set we can just run the program by specifying the service account we just created and it will use our pod security policy!
kubectl trace run --serviceaccount=kubectltrace ip-180-12-0-152.ec2.internal -f read.btIf you used a different namespace other than default for your service account, you will want to specify the namespace too, like this:
kubectl trace run --namespace=mynamespace --serviceaccount=kubectltrace ip-180-12-0-152.ec2.internal -f read.btUsing a patch to customize the trace job§
There may be times when you need to customize the job descriptor that kubectl-trace generates. You can provide a patch file that will modify any of the job's attributes before it executes on the cluster.
The --patch and --patch-type arguments to the run command specify your patch file's location and merge strategy:
--patch- sets the path to a YAML or JSON file containing your patch.--patch-type- sets the strategy that will be used to modify the job descriptor.
Patch strategies
The supported patch strategies are the same as those used by Kubernetes to support in-place API object updates.
These 3 patch strategies are:
json- Sets the JSON patch strategy (see RFC 6209).merge- Sets the JSON merge patch strategy.strategic- JSON strategic merge patch is like the "JSON merge patch" but with different array handling (see Kubernetes strategic merge for more).
Note: You can create your patch files in either YAML or JSON format. The format is independent of the strategy used, e.g. the strategy json refers to the "JSON patch" strategy, not the format of the patch file.
Example: customizing resource limits
A cluster administrator may have set strict resource limits that conflict with the defaults used by kubectl-trace, preventing your job from executing. With a patch you can adjust a job's resource limits to match your cluster's config.
Below is an example of a YAML patch which uses the json strategy ("JSON patch"). This strategy consists of a list of operations (add, replace, remove), a path which references a location in the document, and an optional value (to add or replace).
The patch below replaces the first container's resources section, in order to increase both the request and limit values for cpu and memory:
# mypatch.yaml
- op: replace
  path: /spec/template/spec/containers/0/resources
  value:
    limits:
      cpu: 2
      memory: 500Mi
    requests:
      cpu: 2
      memory: 500Mi
We can now run the job using our patch:
kubectl trace run ip-180-12-0-152.ec2.internal -f read.bt --patch mypatch.yaml --patch-type jsonExample: setting an environment variable
The following JSON format patch adds a BPFTRACE_STRLEN environment variable to the first container. The variable increases bpftrace's string length limit from 64 to 128:
[
  {
    "op": "add",
    "path": "/spec/template/spec/containers/0/env",
    "value": [{ "name": "BPFTRACE_STRLEN", "value": "128" }]
  }
]
kubectl trace run ip-180-12-0-152.ec2.internal -f read.bt --patch mypatch.json --patch-type jsonMore bpftrace programs§
Need more programs? Look here.
Contributing§
Already pumped up to commit some code? Here are some resources to join the discussions in the IOVisor community and see what you want to work on.
- Mailing List: http://lists.iovisor.org/mailman/listinfo/iovisor-dev
- IRC: #iovisor at irc.oftc.net
- Slack #kubectl-trace in the Kubernetes Slack
- Kubectl Trace Issue Tracker: Github Issues
Special thanks to Ramon Gilabert for the logo.
Thank you for getting this far...
This website doesn't allow commenting. The comments policy explains why.